
As someone in the marketing or advertising world, you’ve undoubtedly experienced how statistics can drive conversions. A person is more likely to buy a product if they hear precise details. It’s more influential to say something like, “We have more than 100,000 five-star reviews on Trustpilot” instead of “People love our products and services.”
Both statements suggest the same things, but the first one gets customers interested with specificity. Here are six actionable ways you can use statistics to improve marketing outcomes.
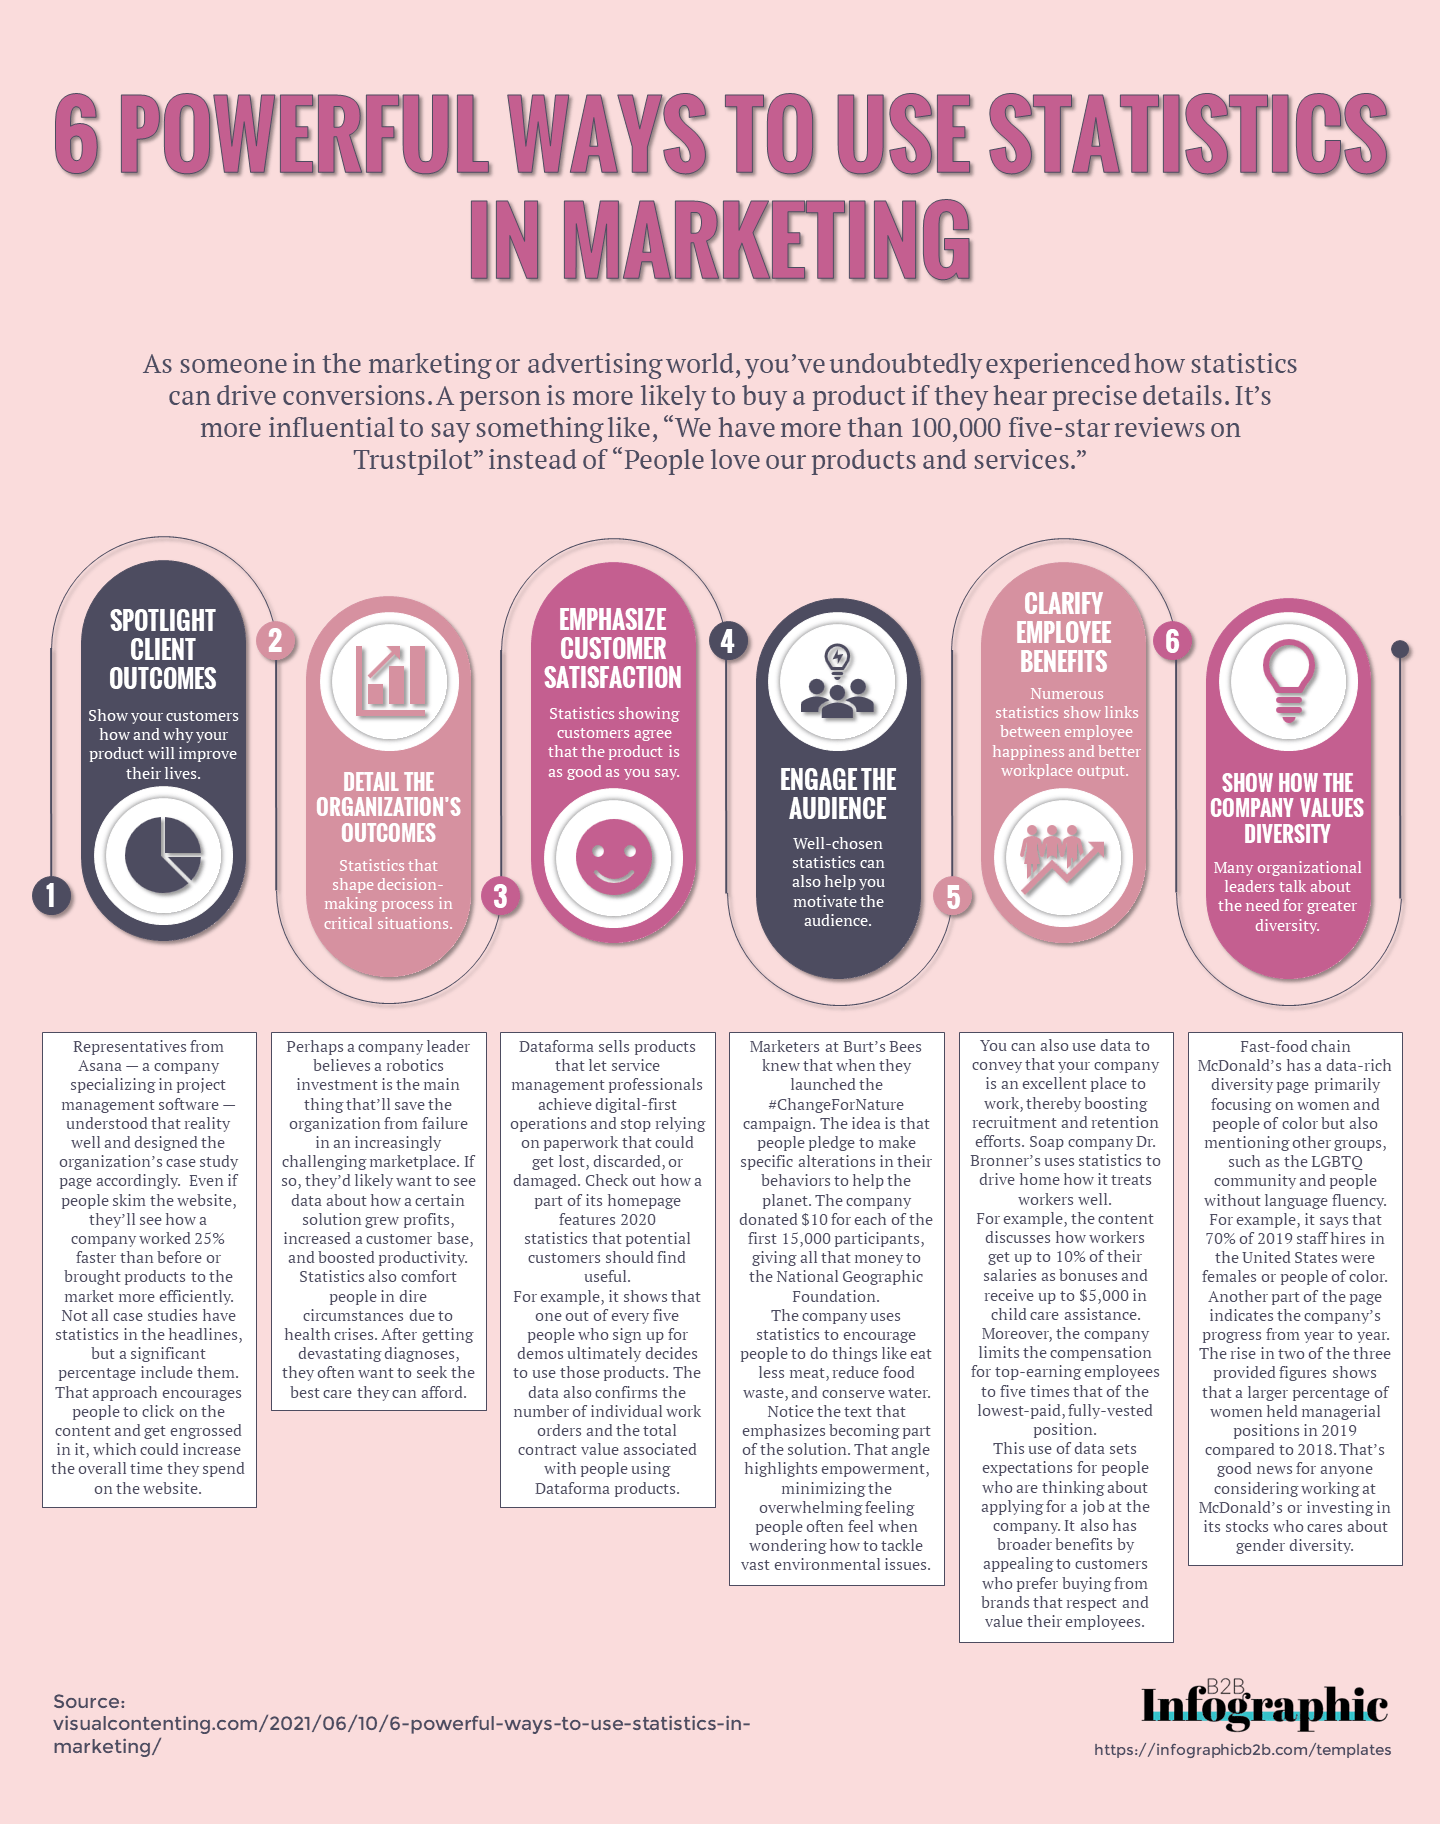
1. Spotlight Client Outcomes
When people consider buying things, they often want clear ideas of what to expect after taking the plunge. Rather than reading that a product will improve their lives or make their organizations more profitable, they want to know why and how that’s true.
Representatives from Asana — a company specializing in project management software — understood that reality well and designed the organization’s case study page accordingly. Even if people skim the website, they’ll see how a company worked 25% faster than before or brought products to the market more efficiently.
Not all case studies have statistics in the headlines, but a significant percentage include them. That approach encourages people to click on the content and get engrossed in it, which could increase the overall time they spend on the website.
Doing this also helps potential customers envision themselves in the positions of the companies that benefited from Asana, getting them more excited about the possibilities. Consider picking one of the most impactful statistics from a case study and using it for your headline. Think about which benefits will most interest the largest potential customer segments.
2. Detail the Organization’s Outcomes
People also appreciate statistics that shape their decision-making process in critical situations. Perhaps a company leader believes a robotics investment is the main thing that’ll save the organization from failure in an increasingly challenging marketplace. If so, they’d likely want to see data about how a certain solution grew profits, increased a customer base, and boosted productivity.
Statistics also comfort people in dire circumstances due to health crises. After getting devastating diagnoses, they often want to seek the best care they can afford. The Cancer Treatment Centers of America website caters to that audience with dedicated pages full of statistics.
For example, the content features five-year survival rates for 11 cancers. People can also peruse pages about patient experience, safety, and quality of life. Showing all that data in one place helps patients make confident decisions about where to go for care. It offers a useful resource for loved ones, too.
If you make a statistics-based page, focus on user-friendliness. The above example’s horizontal top menu is an excellent way to do that. It lets people immediately navigate to the sections that interest them the most.
3. Emphasize Customer Satisfaction
It’s one thing if a product sounds good based on its feature description. The more important goal is for customers to agree that the product is as good as you say. Perhaps you have statistics confirming that’s true.
Dataforma sells products that let service management professionals achieve digital-first operations and stop relying on paperwork that could get lost, discarded, or damaged. Check out how a part of its homepage features 2020 statistics that potential customers should find useful.
For example, it shows that one out of every five people who sign up for demos ultimately decides to use those products. The data also confirms the number of individual work orders and the total contract value associated with people using Dataforma products.
All those things suggest that employees and company leaders find that Dataforma meets their needs and that they trust the products to help them get work done. Consider how you might also compile relevant statistics to show that people love your product. Then, potential customers should feel more excited to join those happy users.
4. Engage the Audience
Well-chosen statistics can also help you motivate the audience. Marketers at Burt’s Bees knew that when they launched the #ChangeForNature campaign. The idea is that people pledge to make specific alterations in their behaviors to help the planet. The company donated $10 for each of the first 15,000 participants, giving all that money to the National Geographic Foundation.
The company uses statistics to encourage people to do things like eat less meat, reduce food waste, and conserve water. Notice the text that emphasizes becoming part of the solution. That angle highlights empowerment, minimizing the overwhelming feeling people often feel when wondering how to tackle vast environmental issues.
A recent study showed that 55% of people would spend more to get eco-friendly products. The Burt’s Bees approach focuses on Earth awareness that could bolster their profits while helping the environment.
However, this use of statistics also suggests how to use statistics to connect with audiences. If you have data that illuminates your company’s values or shows how the organization supports causes, think about relying on it to make the business more relatable and appealing.
5. Clarify Employee Benefits
Numerous statistics show links between employee happiness and better workplace output. You can also use data to convey that your company is an excellent place to work, thereby boosting recruitment and retention efforts. Soap company Dr. Bronner’s uses statistics to drive home how it treats workers well.
For example, the content discusses how workers get up to 10% of their salaries as bonuses and receive up to $5,000 in child care assistance. Moreover, the company limits the compensation for top-earning employees to five times that of the lowest-paid, fully-vested position.
This use of data sets expectations for people who are thinking about applying for a job at the company. It also has broader benefits by appealing to customers who prefer buying from brands that respect and value their employees.
Consider how you might include statistics in marketing materials used to attract potential candidates. For example, you might call out the percentage of people who’ve worked at the business for at least five years or how many employees choose to take advantage of your company’s program that pays for some costs associated with continuing their education.
6. Show How the Company Values Diversity
Many organizational leaders talk about the need for greater diversity. However, using statistics to show progress can confirm whether things are moving in the right direction or indicate it’s time to make even greater efforts.
Fast-food chain McDonald’s has a data-rich diversity page primarily focusing on women and people of color but also mentioning other groups, such as the LGBTQ community and people without language fluency. For example, it says that 70% of 2019 staff hires in the United States were females or people of color.
Another part of the page indicates the company’s progress from year to year. The rise in two of the three provided figures shows that a larger percentage of women held managerial positions in 2019 compared to 2018. That’s good news for anyone considering working at McDonald’s or investing in its stocks who cares about gender diversity.
Explore whether your company has similar figures that show diversity efforts. You may find that the data doesn’t look as impressive as you’d hoped. If so, that’s okay. You could still use the statistics as a starting point to show customers where you are now. Then, set challenging but achievable goals to address any shortcomings in your current diversity levels. Keep the public updated as you come closer to those milestones.
Statistics Show Straightforward Success
People often complain that marketing materials have too much fluff without the substance that helps them make intelligent purchasing decisions. Fortunately, applying statistics to your marketing efforts is a fantastic way to cut down on noise that could make consumers disinterested or skeptical.
Providing people with data also emphasizes your transparency. Some consumers read product descriptions or About Us pages from a company and think, “That sounds good, but am I getting the full picture?” Publishing your data gives the impression that you’re upfront, honest, and have nothing to hide.
Some of the examples here also describe smart uses of statistics to shine a light on company values. When you want to convince the public that a business treats employees well or prioritizes environmental sustainability, data can bring more effectiveness than statements alone. Think of ways to strengthen claims or promises with statistics. Doing that should win more people over and earn their loyalty.
Related Posts


Devin Partida writes about topics concerning tech and the internet. She is also the Editor-in-Chief of ReHack.com.