About this podcast series
The Marketing Automation 101 Podcast from Visual Contenting discusses about the inside out of marketing automation, visual communications and how they can help small to medium businesses succeed through proven methods, best practices and expert advice.
You can subscribe to this podcast series via iTunes, RSS, SoundCloud and Stitcher.
Tweetable Statistics
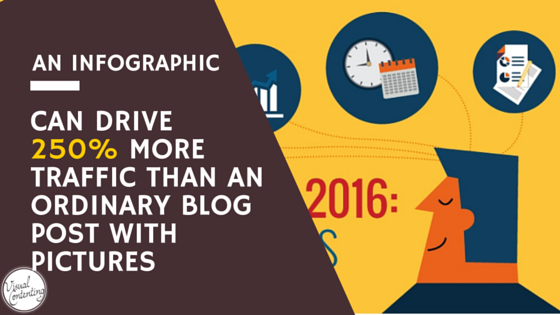
An infographic can drive 250% more traffic than an ordinary blog post with pictures. Click To Tweet
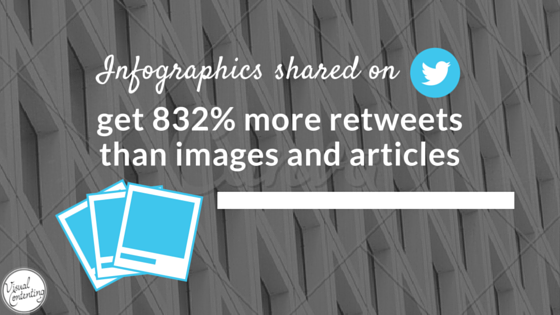
Infographics shared on Twitter get 832% more retweets than images and articles. Click To Tweet
From 2010 to 2012, web traffic specialists KISSmetrics enjoyed more than 41,000 re-tweets referencing its infographic material. Click To Tweet
What’s Piktochart?
Piktochart is simply a cloud-based design tool with drag and drop feature to help you create infographics, presentations, posters and reports. Cloud-based tool means that you don’t have to download or install any kind of software, just go to its website, create an account (which is 100% FREE) and that’s it. You now can freely create as many infographics as you want.
Pros and Cons
Piktochart is convenient and easy to use especially if you are working with steps by steps, how to guide or any simple infographics. If you’re using Lite/Pro account, you can pick one pre-made template among a wide variety of choices and start customize on your own. It’s that simple.
One thing that I don’t like about Piktochart is that it’s less flexible if you want to create long form infographics and it really depends on your creativity to create something unique and fresh. As you know, with pre-made templates you may fall into the trap of “me too” infographics which do no good for your business.
Infographics that You Can Make out of Piktochart
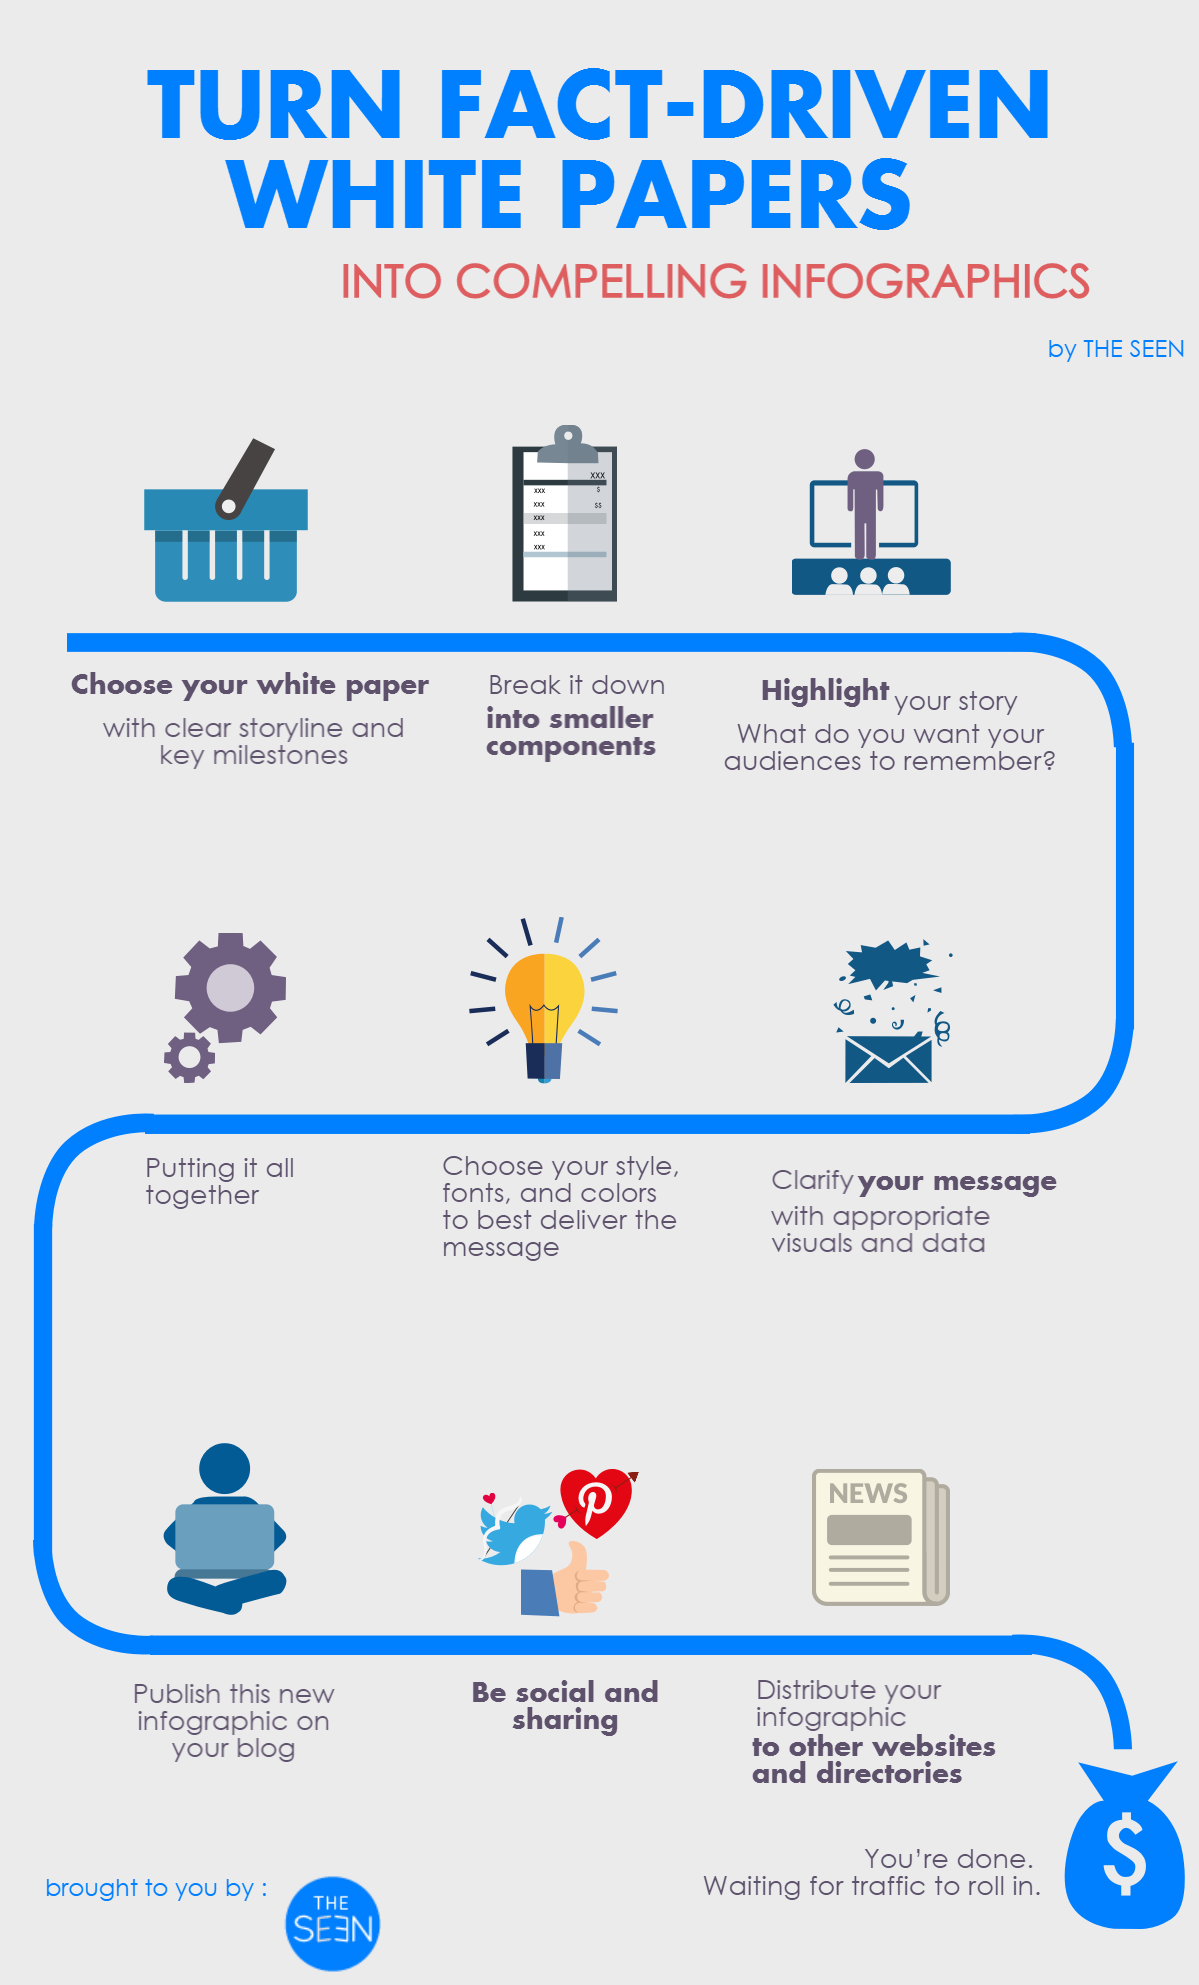
Steps to Turn Fact-driven White Papers into Compelling Infographics
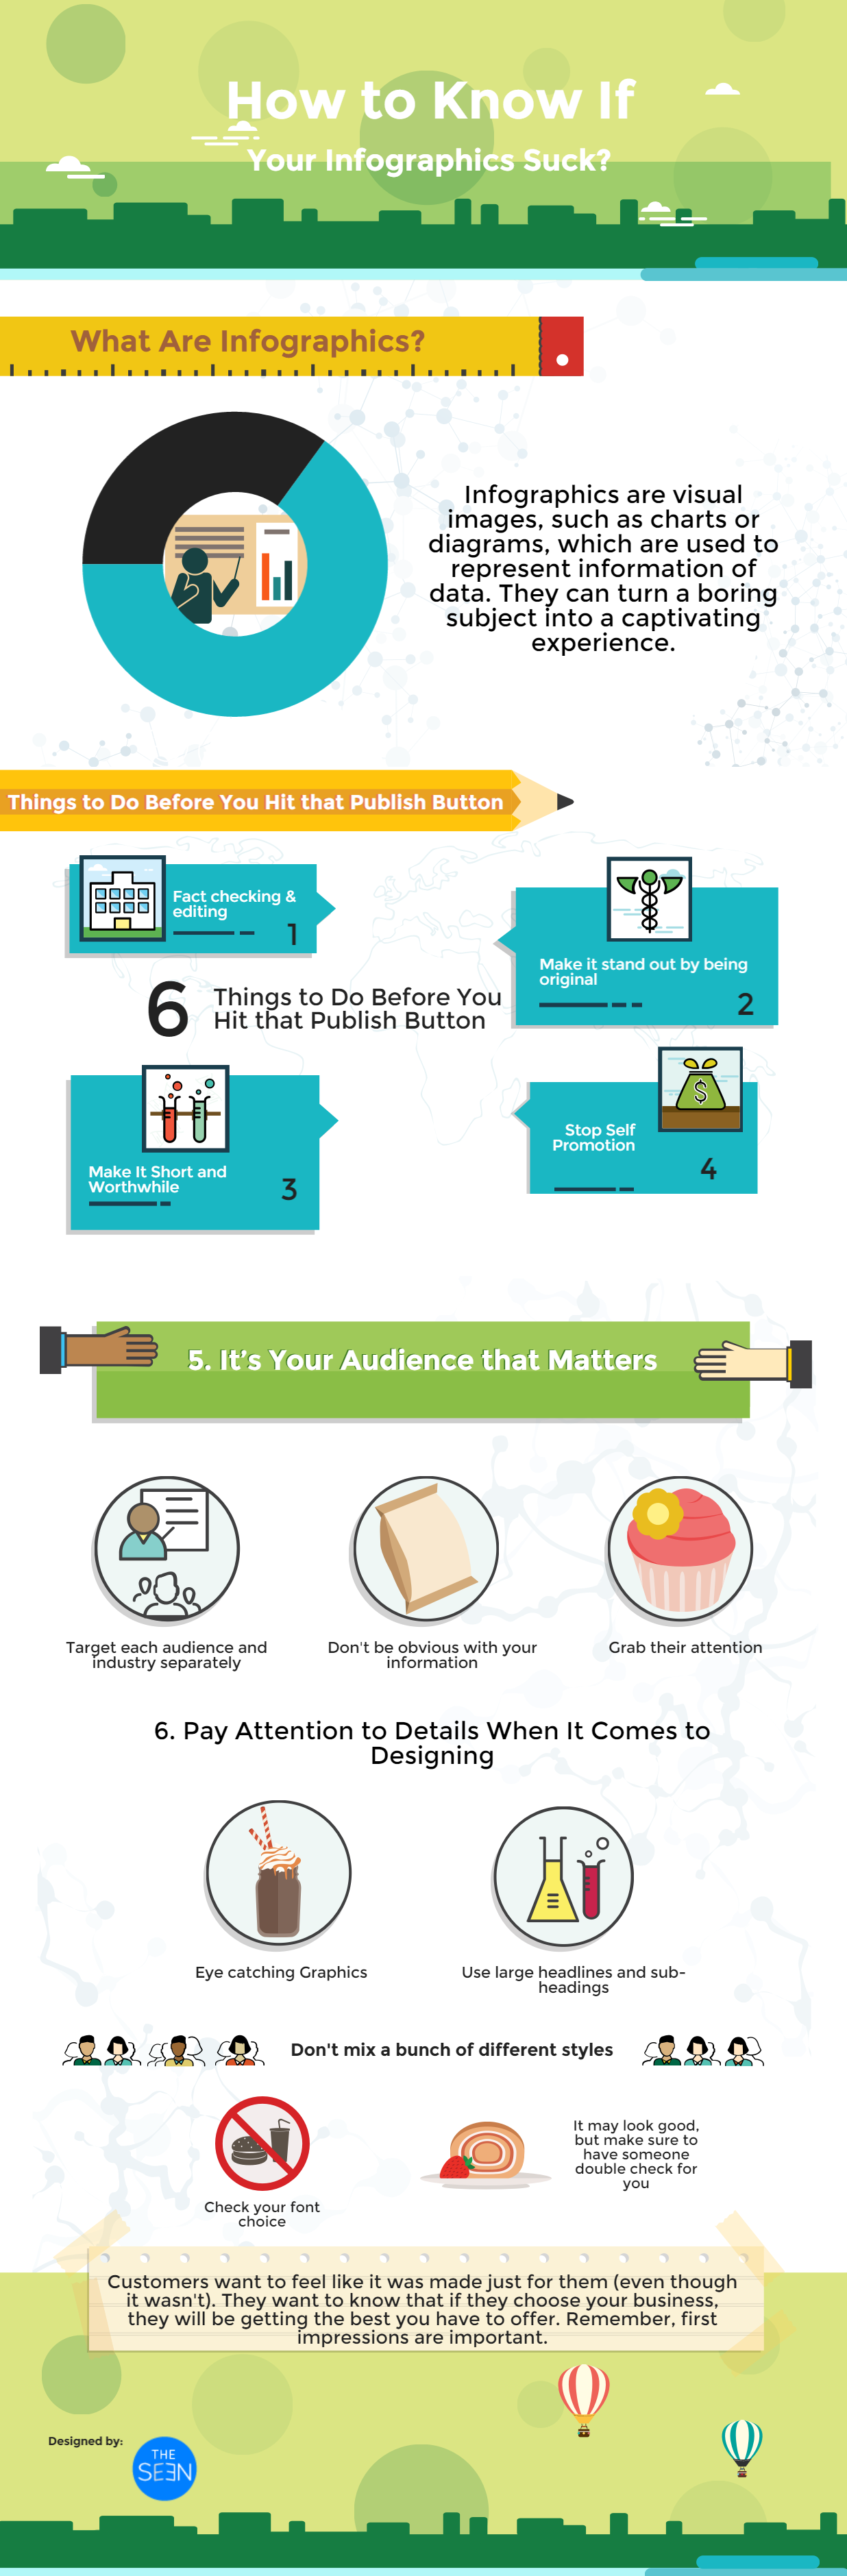
How to Know If Your Infographics Suck?
Additional Resources to Create Killer Infographics with Piktochart
We’re working on creating a FREE online course to guide you steps by steps to create killer infographics with Piktochart and other free infographic makers, we’ll keep you updated once it’s done.
Steps-by-Steps to Immediately Create Killer Infographicshttps://t.co/Lp6kRDQU42 #visualcontent #contentmarketing pic.twitter.com/MUa6ywLbyp
— Visual Contenting (@VContenting) June 6, 2016
If you know or have new marketing tools that you want to share with Visual Contenting community, remember to give us a shout.
Ways to subscribe to Marketing Automation 101 Podcast:
- Click here to subscribe via iTunes
- Click here to subscribe via RSS
- Click here to subscribe via SoundCloud
- Click here to subscribe via Stitcher


Every brand has its own story that is waiting to be told. Storytelling technique combined with creative design is what you need to effectively tell this story.
It’s what we do at Visual Contenting.
We specialize ourselves in helping people and brands visually tell their stories to the right target audience, with the right messages and at the right time.
It’s time to TELL YOUR STORIES WITH PICTURES!!!