Infographics are no doubt your powerful weapon when it comes to content marketing strategy.
Following are stats to prove the point:
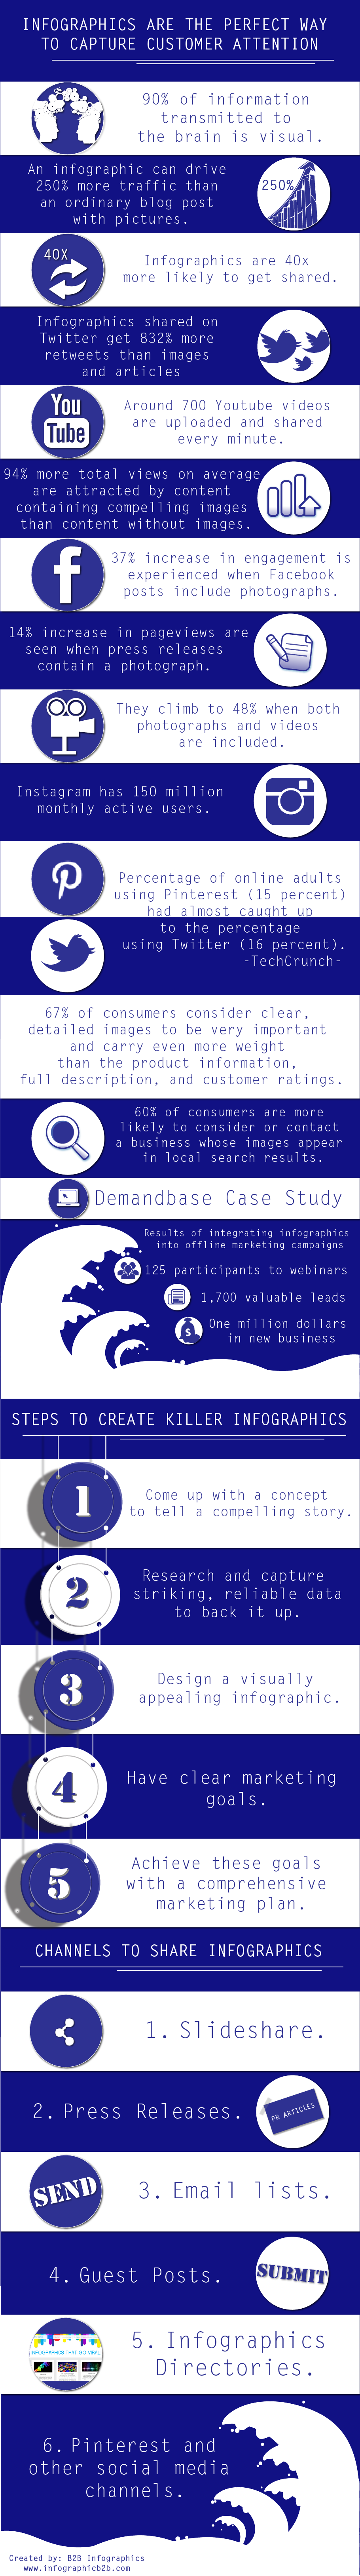
- 90% of information transmitted to the brain is visual. 90% of information transmitted to the brain is visual Share on X
- An infographic can drive 250% more traffic than an ordinary blog post with pictures. An infographic can drive 250% more traffic than an ordinary blog post with pictures Share on X
- Photos are liked twice as much as text updates on Facebook. Photos are liked twice as much as text updates on Facebook Share on X
- Around 700 Youtube videos are uploaded and shared every minute. Around 700 Youtube videos are uploaded and shared every minute Share on X
- 94% more total views on average are attracted by content containing compelling images than content without images. 94% more total views on average are attracted by content containing compelling images than content without images Share on X
- 67% of consumers consider clear, detailed images to be very important and carry even more weight than the product information, full description, and customer ratings. 67% of consumers consider clear, detailed images to be very important and carry even more weight than the product information, full description, and customer ratings Share on X
- 60% of consumers are more likely to consider or contact a business whose images appear in local search results. 60% of consumers are more likely to consider or contact a business whose images appear in local search results Share on X
- 37% increase in engagement is experienced when Facebook posts include photographs. 37% increase in engagement is experienced when Facebook posts include photographs Share on X
- 14% increase in pageviews are seen when press releases contain a photograph. (They climb to 48% when both photographs and videos are included). 14% increase in pageviews are seen when press releases contain a photograph. (They climb to 48% when both photographs and videos are included) Share on X
- Infographics shared on Twitter get 832% more retweets than images and articles. Infographics shared on Twitter get 832% more retweets than images and articles Share on X
- TechCrunch reported that the percentage of online adults using Pinterest (15 percent) had almost caught up to the percentage using Twitter (16 percent). TechCrunch reported that the percentage of online adults using Pinterest (15 percent) had almost caught up to the percentage using Twitter (16 percent) Share on X
- Instagram has 150 million monthly active users. Instagram has 150 million monthly active users Share on X
- When Demandbase integrated Infographics into their offline marketing campaigns like slide presentations, they generated 1,700 valuable leads, 125 participants to their webinars, and saw an increase in views from Slideshare – generating at least one million dollars in new business. When Demandbase integrated Infographics into their offline marketing campaigns like slide presentations, they generated 1,700 valuable leads, 125 participants to their webinars, and saw an increase in views from Slideshare – generating… Share on X
Benefits of a Successful Infographic
#1: Get shared and exposure.
#2: A possibility to go viral.
#3: Fuel your social media channels.
#4: Generate more leads.
#5: Attract SEO linkbacks.
Steps to Create Killer Infographics
#1: Come up with a concept to tell a compelling story.
#2: Research and capture striking, reliable data to back it up.
#3: Design a visually appealing infographic.
#4: Have clear marketing goals.
#5: Achieve these goals with a comprehensive marketing plan.
Channels to Share Infographics
#1: Slideshare.
#2: Press Releases.
#3: Email lists.
#4: Guest Posts.
#5: Infographics Directories.
#6: Pinterest and other social media channels.
Are you infographic lovers?
Every brand has its own story that is waiting to be told. Storytelling technique combined with creative design is what you need to effectively tell this story.
It’s what we do at Visual Contenting.
We specialize ourselves in helping people and brands visually tell their stories to the right target audience, with the right messages and at the right time.
It’s time to TELL YOUR STORIES WITH PICTURES!!!