Why Use Visual Content?
These 15 statistics from Big Thinking Online are powerful reasons to get visual in your next content marketing campaigns.
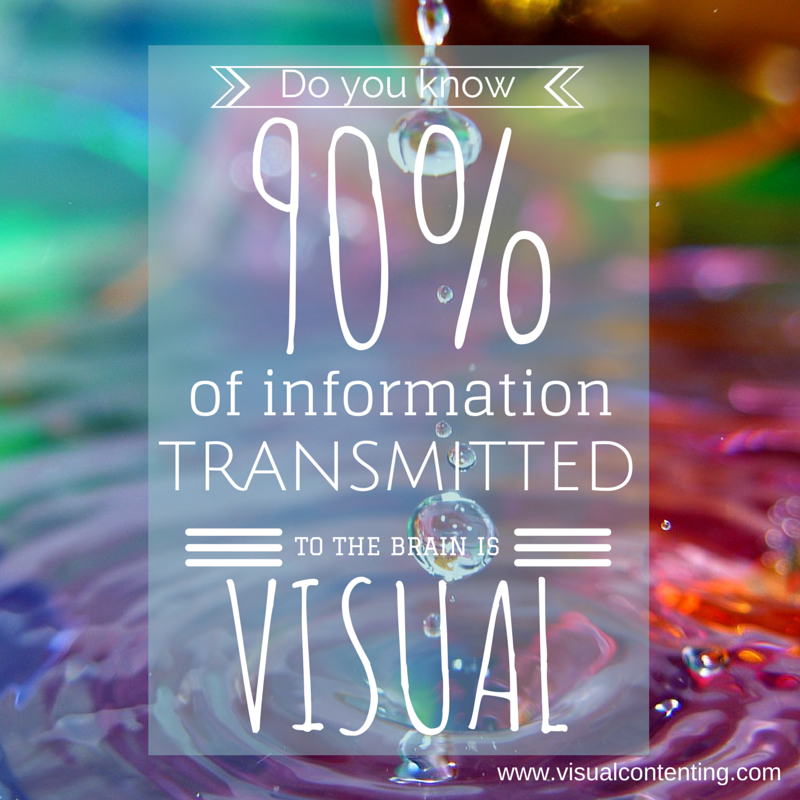
1) 90% of information transmitted to the brain is visual, and visuals are processed 60,000X faster in the brain than text. (Sources: 3M Corporation and Zabisco)
90% of information transmitted to the brain is visual, and visuals are processed 60,000X faster in the brain than text. (Sources: 3M Corporation and Zabisco) Share on X

2) 40% of people will respond better to visual information than plain text. (Source: Zabisco)
40% of people will respond better to visual information than plain text. (Source: Zabisco) Share on X
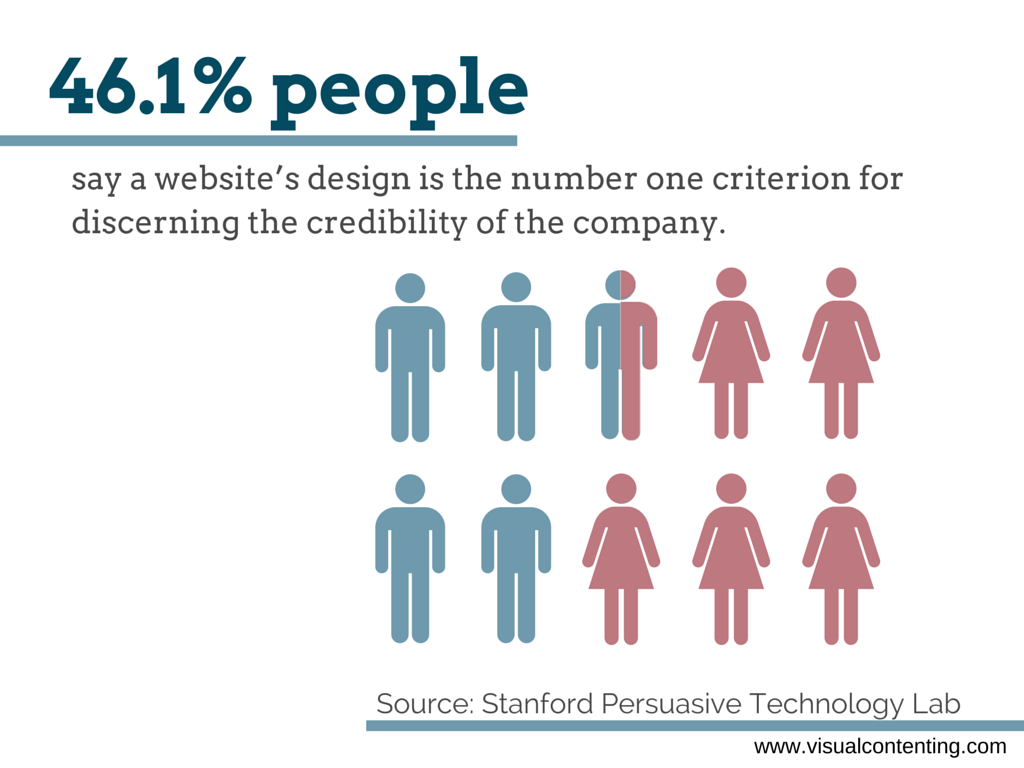
3) 46.1% of people say a website’s design is the number one criterion for discerning the credibility of the company. (Source: Stanford Persuasive Technology Lab)
46.1% of people say a website’s design is the number one criterion for discerning the credibility of the company. (Source: Stanford Persuasive Technology Lab) Share on X
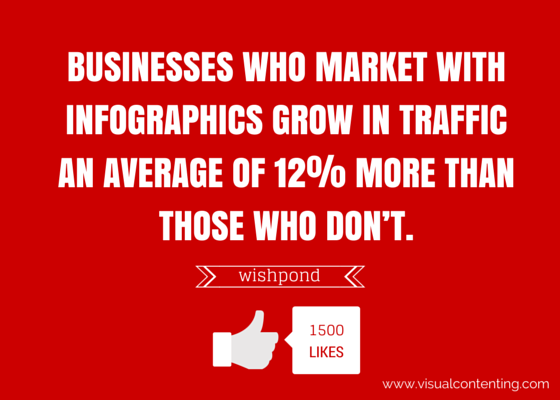
4) Publishers who use infographics grow in traffic an average of 12% more than those who don’t. (Source:AnsonAlex)
Publishers who use infographics grow in traffic an average of 12% more than those who don’t. (Source:AnsonAlex) Share on X
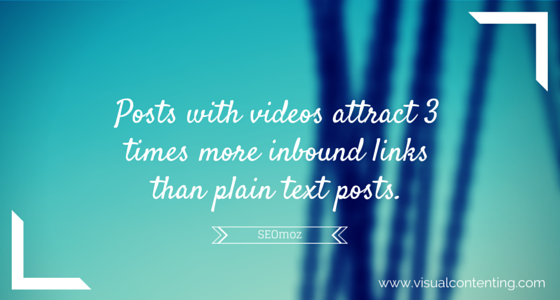
5) Posts with videos attract 3 times more inbound links than plain text posts. (Source: SEOmoz)
Posts with videos attract 3 times more inbound links than plain text posts. (Source: SEOmoz) Share on X
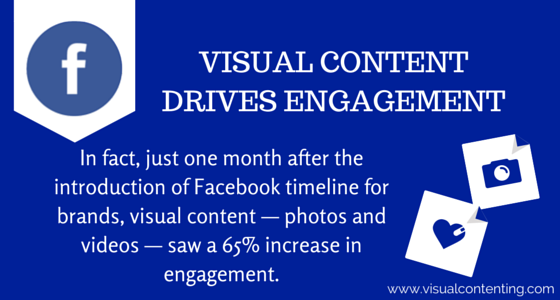
6) Visual content drives engagement. In fact, just one month after the introduction of Facebook timeline for brands, visual content — photos and videos — saw a 65% increase in engagement. (Source: Simply Measured)
Visual content drives engagement. In fact, just one month after the introduction of Facebook timeline for brands, visual content — photos and videos — saw a 65% increase in engagement. (Source: Simply Measured) Share on X
7) On Facebook, photos perform best for likes, comments, and shares as compared to text, video, and links. (Source: Dan Zarrella)
On Facebook, photos perform best for likes, comments, and shares as compared to text, video, and links. (Source: Dan Zarrella) Share on X
8) 85% of the US internet audience watches videos online. The 25-34 age group watches the most online videos, and adult males spend 40% more time watching videos on the internet than females. (Sources:comScore and Nielsen)
85% of the US internet audience watches videos online. The 25-34 age group watches the most online videos, and adult males spend 40% more time watching videos on the internet than females. (Sources:comScore and Nielsen) Share on X
9) Over 72 hours of videos are uploaded each minute on YouTube.com. (Source: YouTube)
Over 72 hours of videos are uploaded each minute on YouTube.com. (Source: YouTube) Share on X
10) 700 YouTube videos are shared on Twitter every minute. (Source: YouTube)
700 YouTube videos are shared on Twitter every minute. (Source: YouTube) Share on X
11) Viewers spend 100% more time on pages with videos on them. (Source: MarketingSherpa)
Viewers spend 100% more time on pages with videos on them. (Source: MarketingSherpa) Share on X
12) Mobile video viewing increased 35% from 2010 to 2011. (Source: Nielsen)
Mobile video viewing increased 35% from 2010 to 2011. (Source: Nielsen) Share on X
13) 25 million smartphone users stream 4 hours of mobile video per month. 75% of smartphone users watch videos on their phones, 26% of whom use video at least once a day. (Sources: Ooyala and Ipsos)
25 million smartphone users stream 4 hours of mobile video per month. 75% of smartphone users watch videos on their phones, 26% of whom use video at least once a day. (Sources: Ooyala and Ipsos) Share on X
14) Mobile video subscription is expected to hit $16 billion in revenue by 2014, with over 500 million subscribers. (Source: Ooyala)
Mobile video subscription is expected to hit $16 billion in revenue by 2014, with over 500 million subscribers. (Source: Ooyala) Share on X
15) Viewers are 85% more likely to purchase a product after watching a product video. (Source: Internet Retailer)
Viewers are 85% more likely to purchase a product after watching a product video. (Source: Internet Retailer) Share on X
You can also view and add more stats about visual content to this list on List.ly:
[listly id="WsL" layout="magazine" show_header="true" show_author="true" show_sharing="true" show_tools="true" per_page="25"]
Visual Content Benefits
According to Heidi Cohen, 7 visual content benefits are:
Visual content marketing is snackable. Share on X
Visual content marketing is sharable. Share on X
Visual content is social media friendly. Share on X
Visual content enhances your brand. Share on X
Visual content supports search optimization. Share on X
Visual content helps build audience. Share on X
Visual content eliminates language barriers. Share on X
Free Online Visual Content Tools
[listly id="WsH" layout="full" show_header="true" show_author="true" show_sharing="true" show_tools="true" per_page="25"]
Related Posts


Every brand has its own story that is waiting to be told. Storytelling technique combined with creative design is what you need to effectively tell this story.
It’s what we do at Visual Contenting.
We specialize ourselves in helping people and brands visually tell their stories to the right target audience, with the right messages and at the right time.
It’s time to TELL YOUR STORIES WITH PICTURES!!!


[…] Top 7 Visual Content Tools to Make You Stand Out Visually on Social Media […]
Visit here for buy real american spotify followers you can also check buy australia linkedin connections here.