Though infographics are taking our online world by storm, many infographics out there suck. They either fall short of quality or they lack of creativity. That said, in order to produce great infographics, you have to put in a lot of time, money and human resources. Yes, it does pay off. But sometimes, you simply can’t afford it especially when you’re just starting out.
Today I want to introduce a great tool to create infographics in next to no time. And what I mean is creating complex, data-heavy infographics. That tool is Infogram.
Tweetable Statistics
Do you know that:
Visual elements can generate up to 94% more views than simple blocks of text. Click To Tweet
 37% increase in engagement with target audiences through infographs. Click To Tweet
 People are 3x more likely to share infographics than documents. Click To Tweet
What’s Infogram?
Infogr.am is a cloud-based design tool that allows you to create infographics, reports, charts, graphs and maps in minutes. Actually, I’ve personally used it and really, really, really love it. You will love it for sure.
Pros and Cons
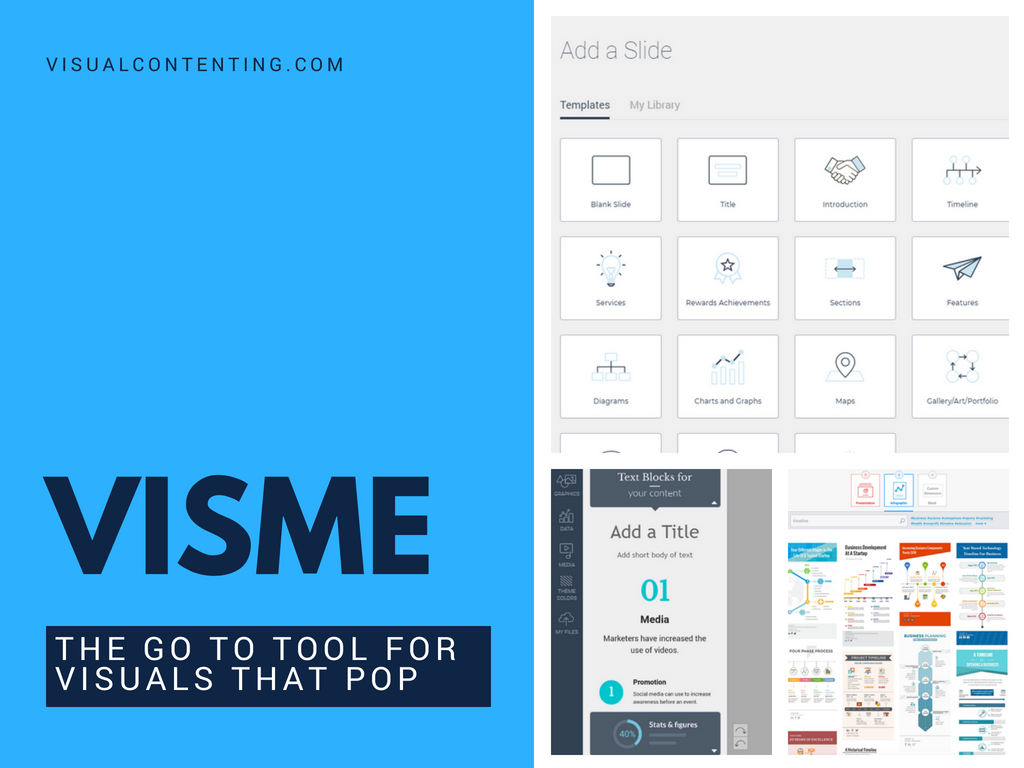
Meanwhile Piktochart, Visme and Canva provide you with templates to create your infographics in a simple way. You just need to add some text, icons, images, small charts or graphs that illustrate some interesting points and that’s it.
Infogram is different, it actually creates infographics. I’m talking about a tool to process complex data and automatically present it in a compelling way. You will be surprised that inside Infogram dashboard, you have no graphic elements to drag and drop but a powerful function to import your data and lay it out into wonderful charts and graphs.
If you’re creating some kind of 5 tips for empowering your pins or how to get rich quick guide, Infogram may not be an ideal tool. Rather than that if you’re presenting complex, data-heavy reports that might need more in-depth analytics, Infogram is more than perfect.
One thing that makes Infogram unique is that you can’t download your work as your data still needs a tool to process and present. You can only embed your infographics on the Web or via social networks. And people can go directly to the link you provide to see your infographics. You can also see how good your infographics are doing by watching statistics in terms of views, geographic location and referrals.
What You Can Do with Infogram?
Like we usually say the number speaks for itself, Infogram is that tool to help our data speaks for itself.
#1: Present Data into Beautiful Charts and Graphs
Using Infogram, you have the power to present any complex data into beautiful, comprehensive charts or graphs that speak directly to your target audiences.
You can compose your data right in the dashboard or you can upload your own .csv or .xls files. Then you can choose which chart type that best presents your data among a variety of charts inside Infogram.
#2: Add Maps to Your Infographics
Within Infogram, you can easily add maps to your infographics, world map, USA map or any country maps that can resonate with your infographics. One thing to remember is that this is not static maps, this is a map with data. And you can modify the data manually or upload your own .csv or .xls files.
#3: Add a Picture or Text to Your Infographics
Infogram also allows you to add text or picture to your infographics to better visualize your messages.
#4: Add Media and Videos to Your Infographics
You can also add videos from Youtube, Vimeo or add URL, presentations from Slideshare to your infographics to make them more appealing.
Infographics that You Can Make out of Infogram
I've used Infogram to create the following infographic showing a bit of statistics about Visual Contenting traffic, demographics and geographic location in last year. The data here is just for reference. You can see that Infogram has successfully presented our complex data into this amazing infographic.
Additional Resources to Best Use Infogram
We’re working on creating a FREE online course to guide you steps by steps to create killer infographics with Infogram and other free infographic makers, we’ll keep you updated once it’s done.
Steps-by-Steps to Immediately Create Killer Infographicshttps://t.co/Lp6kRDQU42 #visualcontent #contentmarketing pic.twitter.com/MUa6ywLbyp
— Visual Contenting (@VContenting) June 6, 2016
If you know or have new marketing tools that you want to share with Visual Contenting community, remember to give us a shout.
Community manager at Visual Contenting. Jacqueline loves to talk about social media trends, new technology and how they help businesses accelerate their marketing efforts.


[…] Though infographics are taking our online world by storm, many infographics out there suck. They either fall short of quality or they lack of creativity. That said, in order to produce great infographics, you have to put in a lot of time, money and human resources. Yes, it does pay off. But sometimes, you simply can’t… [Read More] […]